65 Data Analyst Interview Questions and Answers

As businesses increasingly rely on data-driven decision-making, the demand for skilled data analysts continues to grow. If you’re aspiring to become a data analyst or preparing for a job interview in this field, it’s crucial to familiarize yourself with common interview questions. To help you in your preparation, we have compiled a list of the top 60 data analyst interview questions and answers for the year 2023. These questions cover a wide range of topics, including data analysis techniques, statistical concepts, programming languages, and more.
Technical Questions
1. What is data analysis, and why is it important in the business world?
Data analysis is the process of examining, cleansing, transforming, and modeling data to discover meaningful insights, draw conclusions, and support decision-making. In the business world, data analysis is crucial as it allows organizations to make informed decisions, identify patterns and trends, understand customer behavior, optimize processes, and gain a competitive edge.
2. Explain the steps involved in the data analysis process?
The data analysis process typically involves the following steps:
- Defining the problem and formulating the research question.
- Data collection, which involves gathering relevant data from various sources.
- Data cleaning and preprocessing to ensure data quality and remove any inconsistencies or errors.
- Data exploration and descriptive statistics to understand the dataset and identify patterns or relationships.
- Data analysis using statistical techniques, machine learning algorithms, or other analytical methods.
- Interpretation and drawing conclusions based on the analysis results.
- Communicating the findings through visualizations, reports, or presentations.
Read also – 50 Most Common Interview Questions and Successful Answers
3. What differentiates between structured and unstructured data?
Structured data refers to organized data that is typically stored in a fixed format, such as relational databases, spreadsheets, or CSV files. It is easily searchable and can be analyzed using traditional data analysis techniques. On the other hand, unstructured data does not have a predefined structure and can be in the form of text documents, social media posts, images, videos, etc. Analyzing unstructured data requires advanced techniques such as natural language processing, image recognition, or sentiment analysis.
4. What are the different types of data distributions?
There are several types of data distributions commonly encountered in data analysis:
- Normal Distribution: Also known as the Gaussian distribution, it is characterized by a bell-shaped curve with a symmetric and continuous probability density function.
- Skewed Distribution: Skewed distributions are asymmetrical and have a longer tail on either the left (negative skew) or right (positive skew) side of the distribution.
- Uniform Distribution: In a uniform distribution, all values have an equal probability of occurring, resulting in a rectangular-shaped distribution.
- Exponential Distribution: Exponential distributions are commonly used to model the time between events in a Poisson process.
- Log-Normal Distribution: Log-normal distributions arise when the logarithm of a variable follows a normal distribution.
5. Explain the concept of hypothesis testing and its importance in data analysis?
Hypothesis testing is a statistical method used to make inferences about a population based on sample data. It involves formulating a null hypothesis (assumption of no effect or relationship) and an alternative hypothesis. By collecting and analyzing data, we can determine whether the evidence supports rejecting or failing to reject the null hypothesis. Hypothesis testing is important in data analysis as it allows us to make data-driven decisions, validate assumptions, and determine the statistical significance of observed effects or relationships.
6 Describe the difference between Type I and Type II errors?
Type I error, also known as a false positive, occurs when we reject the null hypothesis when it is actually true. This indicates that we have found a significant effect or relationship where none exists. Type II error, also known as a false negative, occurs when we fail to reject the null hypothesis when it is actually false. This means that we have missed a significant effect or relationship. Type I and Type II errors are inversely related, meaning reducing one type of error increases the likelihood of the other type occurring. The balance between these errors is controlled by the chosen level of significance (alpha) and the power of the statistical test.
7. What is the significance of the Central Limit Theorem in statistical analysis?
The Central Limit Theorem states that when independent random variables are added, their sum tends to follow a normal distribution, regardless of the shape of the original distribution. This theorem is significant in statistical analysis because it allows us to make assumptions about the population distribution based on a sample. It enables the use of powerful inferential statistical techniques, such as hypothesis testing and confidence intervals, which rely on the assumption of a normal distribution or large sample sizes.
8. How do you handle missing data in a dataset?
Handling missing data requires careful consideration. Some common approaches include:
- Deleting the rows or columns with missing data if the missingness is random and doesn’t significantly affect the analysis.
- Imputing missing values using techniques such as mean imputation, median imputation, or regression imputation.
- Using advanced techniques like multiple imputation, which estimates missing values based on relationships with other variables.
- Considering the mechanism causing the missingness and using appropriate imputation techniques accordingly. The choice of approach depends on the nature and extent of missing data, as well as the specific analysis goals.
9. What is the purpose of correlation analysis in data analysis?
Correlation analysis measures the strength and direction of the relationship between two variables. It helps to determine if there is a statistical association between variables and the extent to which changes in one variable are related to changes in another. Correlation analysis is valuable in data analysis as it aids in identifying patterns, understanding dependencies, assessing the predictive power of variables, and informing decision-making. It is commonly used in fields such as finance, marketing, and social sciences.
10. Explain the concept of outlier detection and its impact on data analysis?
Outliers are data points that significantly deviate from the rest of the dataset. Outlier detection involves identifying and dealing with these extreme values. Outliers can skew statistical analyses, affect model performance, or introduce bias in data analysis results. Therefore, it is crucial to detect and handle outliers appropriately. Techniques for outlier detection include statistical methods like Z-score or modified Z-score, visualization-based methods such as box plots or scatter plots, and advanced techniques like clustering or machine learning algorithms. Removing or adjusting outliers should be done cautiously, taking into account the context and goals of the analysis.
11. What is the difference between supervised and unsupervised learning?
Supervised learning involves training a model using labeled data, where the input variables (features) are known, and the corresponding output variables (labels) are provided. The model learns from the labeled examples to make predictions or classify new, unseen data. In contrast, unsupervised learning involves training a model on unlabeled data, without any predefined output variables. The model identifies patterns, clusters, or structures in the data on its own. Unsupervised learning is useful for exploratory analysis, data clustering, dimensionality reduction, or anomaly detection.
Read also – 30 Important Things You Should Know Before Your Job Interview
12. Describe the steps involved in building a machine-learning model?
The steps involved in building a machine-learning model typically include:
- Data preprocessing: This involves cleaning the data, handling missing values, scaling or normalizing the features, and splitting the data into training and testing sets.
- Choosing a model: Selecting an appropriate machine learning algorithm based on the problem type, available data, and desired outcomes.
- Training the model: This involves feeding the training data into the model, allowing it to learn patterns and relationships.
- Model evaluation: Assessing the performance of the trained model using evaluation metrics and testing it on the unseen test data.
- Model optimization: Fine-tuning the model by adjusting hyperparameters, feature selection, or applying regularization techniques to improve performance.
- Deploying the model: Integrating the trained model into the production environment to make predictions on new, real-world data.
13. What are some common feature selection techniques in machine learning?
Feature selection aims to identify the most relevant and informative features from a dataset. Some common techniques include:
- Univariate selection: Selecting features based on statistical tests like chi-squared, ANOVA, or correlation coefficient.
- Recursive Feature Elimination (RFE): Iteratively removing features by assessing their importance using a machine learning algorithm.
- Principal Component Analysis (PCA): Transforming the original features into a lower-dimensional space while retaining most of the variability in the data.
- L1 regularization (Lasso): Applying a penalty to the model coefficients, leading to sparse solutions and automatic feature selection.
- Tree-based methods: Using decision trees or ensemble methods like Random Forest or Gradient Boosting, which inherently provide feature importance measures. The choice of technique depends on the dataset, problem domain, and the specific requirements of the machine learning task.
14. Explain the concept of cross-validation and its importance in model evaluation?
Cross-validation is a technique used to assess the performance and generalization ability of a machine learning model. It involves dividing the available data into multiple subsets or folds. The model is trained on a portion of the data (training set) and evaluated on the remaining fold(s) (validation set). This process is repeated multiple times, with different subsets as the validation set, and the performance metrics are averaged. Cross-validation is important because it helps to estimate how well the model will perform on unseen data, mitigating the risk of overfitting and providing a more reliable evaluation of the model’s performance.
15. How do you handle imbalanced datasets in machine learning?
Imbalanced datasets refer to datasets where the distribution of class labels is skewed, with one class dominating the other(s). Some approaches to handle imbalanced datasets include:
- Resampling techniques: Oversampling the minority class by replicating examples or undersampling the majority class by reducing the number of examples. This helps balance the class distribution.
- Synthetic minority oversampling technique (SMOTE): Creating synthetic examples of the minority class by interpolating existing examples.
- Cost-sensitive learning: Assigning different misclassification costs to different classes to account for the class imbalance.
- Ensemble methods: Using ensemble techniques like Random Forest or Gradient Boosting, which can handle imbalanced datasets better than individual models.
- Collecting more data: If feasible, collecting additional data for the minority class to improve the representation and balance in the dataset. The choice of approach depends on the specific problem, the available data, and the impact of misclassification on different classes.
SQL and Database Questions
16. What is a primary key in a database, and why is it important?
A primary key in a database is a unique identifier that uniquely identifies each record in a table. It ensures data integrity by enforcing uniqueness and preventing duplicate or null values in the key field. Primary keys are important because they serve as the basis for establishing relationships between tables in a relational database. They provide a way to uniquely identify and retrieve specific records, maintain data consistency, and enable efficient data retrieval operations.
17. Write a SQL query to find the average salary of employees in a table?
The SQL query to find the average salary of employees in a table named “employees” would be: SELECT AVG (salary) AS average_salary FROM employees;
This query calculates the average of the “salary” column in the “employees” table and aliases it as “average_salary” for clarity.
18. What are indexes in a database, and how do they improve query performance?
Indexes in a database are data structures that improve the speed of data retrieval operations. They provide quick access to specific rows in a table based on the values in one or more columns. By creating an index on a column, the database system organizes the data in a way that reduces the number of disk I/O operations required to locate the desired data. Indexes improve query performance by allowing the database engine to locate and retrieve data more efficiently. When a query involves conditions or sorting based on indexed columns, the database can use the index to quickly locate the relevant data, rather than scanning the entire table. This leads to faster query execution times, especially in large tables.
19. Describe the difference between UNION and UNION ALL in SQL?
UNION and UNION ALL are SQL set operators used to combine the results of two or more SELECT statements into a single result set. The main difference between them is that UNION removes duplicate rows from the result set, while UNION ALL includes all rows, including duplicates.
- UNION: The UNION operator combines the results of two or more SELECT statements and returns a distinct set of rows. It eliminates duplicate rows from the result set. The column names and data types in all SELECT statements must match, and the order of the columns in each SELECT statement should be the same.
- UNION ALL: The UNION ALL operator combines the results of two or more SELECT statements and returns all rows, including duplicates. It does not remove duplicate rows. The column names and data types should match, but the order of the columns can vary.
20. How do you optimize a SQL query for better performance?
There are several ways to optimize a SQL query for better performance:
- Use appropriate indexes on columns used in WHERE, JOIN, and ORDER BY clauses to speed up data retrieval.
- Minimize the use of functions or calculations in WHERE clauses, as they can hinder index usage.
- Limit the number of rows returned by using the SELECT statement’s WHERE clause effectively.
- Avoid using “SELECT *”; instead, specify only the necessary columns in the SELECT statement.
- Optimize JOIN operations by selecting the appropriate JOIN type (e.g., INNER JOIN, LEFT JOIN) and ensuring that join columns are indexed.
- Use EXPLAIN or query execution plans to analyze and optimize query performance.
- Consider denormalizing the database schema if it improves query performance in specific cases.
- Regularly analyze and update table statistics to ensure the query optimizer has accurate information for query execution.
Read also – 10 Great Part-Time Jobs
21. Explain the concept of database normalization and its benefits?
Database normalization is the process of organizing data in a database to eliminate redundancy and improve data integrity. It involves breaking down a large table into multiple smaller tables and establishing relationships between them. The normalization process follows a set of rules (normal forms) that guide the organization of data. The benefits of database normalization include:
- Minimizing data redundancy: By eliminating duplicate data, normalization reduces storage requirements and ensures data consistency.
- Improving data integrity: Normalization enforces data integrity constraints by preventing inconsistencies and anomalies.
- Enhancing data consistency: With normalized data, updates and modifications only need to be made in one place, reducing the risk of inconsistent data.
- Simplifying data maintenance: Normalized databases are easier to maintain and update as changes can be made in a localized manner.
- Facilitating efficient query operations: Normalization allows for efficient data retrieval, as data is stored in a structured and logical manner.
22. What is the purpose of the GROUP BY clause in SQL?
The GROUP BY clause in SQL is used to group rows based on one or more columns. It is typically used in conjunction with aggregate functions such as SUM, COUNT, AVG, MIN, or MAX to perform calculations on groups of rows rather than individual rows. The main purpose of the GROUP BY clause is to generate summary information from a table. It allows for the creation of subsets of data based on common values in specified columns. The resulting grouped data can then be used to generate reports, perform calculations, or analyze data based on different categories or groups.
Programming Questions
23. Which programming languages are commonly used in data analysis, and why?
Python and R are two of the most commonly used programming languages in data analysis. Python is popular due to its versatility, readability, and extensive libraries such as Pandas, NumPy, and Scikit-learn, which provide powerful data manipulation, analysis, and machine learning capabilities. R is preferred for its strong statistical and visualization capabilities, with packages like dplyr and ggplot2. Both languages have a large and active data science community, making it easier to find resources, libraries, and support for data analysis tasks.
24. Explain the difference between Python lists and dictionaries?
In Python, lists and dictionaries are both used to store collections of data, but they differ in their structure and functionality.
- Lists: Lists are ordered, mutable (modifiable), and can contain elements of different data types. They are defined using square brackets ([]), and elements are accessed by their index. Lists are suitable for maintaining an ordered sequence of items.
- Dictionaries: Dictionaries are unordered, mutable, and consist of key-value pairs. They are defined using curly braces ({}) and use keys to access values instead of indexes. Dictionaries are useful for mapping unique keys to corresponding values and allow for efficient lookup and retrieval of data based on keys.
25. How do you handle errors and exceptions in Python?
In Python, errors and exceptions are handled using try-except blocks. The try block contains the code that may raise an exception, while the except block handles the exception if it occurs.
To handle errors and exceptions:
- Place the code that might raise an exception within the try block.
- Use the except block to catch specific exceptions or a general exception (Exception) to handle any unexpected errors.
- Optionally, use the else block to execute code if no exceptions occur in the try block.
- Finally, use the finally block to execute code that should be run regardless of whether an exception occurred or not.
By handling errors and exceptions, you can prevent your program from crashing and gracefully handle exceptional conditions, providing informative error messages or taking alternative actions as needed.
26. What are the key features of the Pandas library in Python?
Pandas is a powerful data manipulation and analysis library in Python. Its key features include:
- DataFrame: The core data structure in Pandas, which provides a two-dimensional table-like structure for handling structured data.
- Data manipulation: Pandas offers flexible data manipulation capabilities, including indexing, filtering, grouping, joining, and reshaping data.
- Missing data handling: Pandas provides functions to handle missing or null values in a dataset, allowing for data cleaning and preprocessing.
- Time series analysis: Pandas offers robust tools for working with time series data, including date/time indexing, frequency conversion, and resampling.
- Data input/output: Pandas supports reading and writing data in various formats such as CSV, Excel, SQL databases, and more.
- Data visualization: While not its primary focus, Pandas integrates well with other libraries like Matplotlib and Seaborn for data visualization purposes.
27. How do you read data from a CSV file in Python?
To read data from a CSV file in Python, you can use the built-in csv module or the Pandas library. Here’s an example using Pandas:
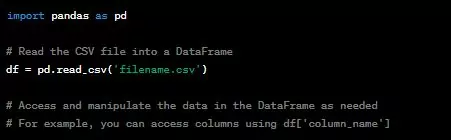
read_csv() function from Pandas is used to read the CSV file into a DataFrame object, which is a tabular data structure with rows and columns. Once the data is loaded into the DataFrame, you can perform various data analysis and manipulation operations.
28. What is the purpose of the NumPy library in Python?
NumPy (Numerical Python) is a fundamental library for scientific computing in Python. It provides support for large, multi-dimensional arrays and matrices, along with a wide range of mathematical functions to operate on these arrays efficiently. The key purposes of NumPy are:
- Efficient numerical operations: NumPy allows for fast and efficient numerical computations, thanks to its array-oriented programming and optimized implementations of mathematical operations.
- Multi-dimensional array manipulation: NumPy provides a powerful N-dimensional array object, ndarray, which allows for efficient storage and manipulation of large datasets.
- Linear algebra operations: NumPy includes a comprehensive suite of linear algebra functions, such as matrix operations, solving linear equations, eigenvalues, and eigenvectors.
- Integration with other libraries: NumPy serves as the foundation for many other libraries in the scientific Python ecosystem, including Pandas, Matplotlib, and SciPy, enabling seamless integration and interoperability between these libraries.
29. Explain the concept of lambda functions in Python?
Lambda functions, also known as anonymous functions, are small, single-line functions defined without a name. They are created using the lambda keyword in Python. Lambda functions are typically used for simple, one-time operations where defining a full function is unnecessary.
Key points about lambda functions:
- They can take any number of arguments but can only have one expression.
- They are defined using the syntax:
lambda arguments: expression. - They are often used in conjunction with higher-order functions like
map(),filter(), andreduce(). - Lambda functions can make code more concise and readable by avoiding the need for defining a separate named function.
For example, a lambda function to calculate the square of a number can be defined as:
Here,square is a lambda function that takes an argument x and returns its square.
30. How do you handle memory-related issues when working with large datasets in Python?
When working with large datasets in Python, memory-related issues can arise due to the limited memory available. Here are some approaches to handle such issues:
- Data Chunking: Process the data in smaller, manageable chunks instead of loading the entire dataset into memory at once. Process one chunk at a time, discard it, and move on to the next chunk. This approach is commonly used with libraries like Pandas or by iterating over files or database queries.
- Data Streaming: If possible, process the data in a streaming fashion rather than loading it all into memory. This approach allows you to process data sequentially, one piece at a time, without needing to store it all in memory simultaneously.
- Data Compression: If the dataset contains redundant or repetitive data, consider using compression techniques to reduce memory usage. Libraries like
gzip,bz2, orzlibcan be used to compress and decompress data on-the-fly. - Data Type Optimization: Review the data types of your variables and choose appropriate representations that minimize memory usage. For example, using smaller integer types or float16 instead of float32 can significantly reduce memory usage.
- Out-of-Core Computing: Utilize libraries like Dask or Vaex, which implement out-of-core computing techniques. These libraries allow you to work with datasets that are larger than the available memory by automatically handling data partitioning and executing computations in a distributed manner.
- Data Filtering: If possible, filter the dataset to focus on the specific data needed for analysis rather than loading and processing the entire dataset. This can significantly reduce memory requirements.
Data Visualization and Reporting
31. How do you choose the appropriate data visualization technique for a given dataset?
Choosing the appropriate data visualization technique for a given dataset involves considering the nature of the data and the message you want to convey. Here are some key factors to consider:
- Data type: Determine if the data is categorical, numerical, time series, or spatial. Different data types lend themselves to specific visualization techniques.
- Relationship: Consider the relationships or patterns you want to highlight. For example, if you want to compare values across different categories, a bar chart or a grouped column chart might be suitable.
- Data distribution: Identify the distribution of the data. Histograms or box plots can be effective for displaying the distribution of numerical data.
- Data size: Assess the size of the dataset. For large datasets, aggregated visualizations, such as heat maps or scatterplots with sampling or density estimation, may be more appropriate.
- Audience and purpose: Consider the intended audience and the message you want to convey. Choose visualizations that align with the audience’s familiarity with data and the level of detail necessary to convey your message effectively.
By considering these factors, you can select the visualization technique that best represents the data and effectively communicates the insights you want to convey.
Read also – 10 Most Common Job Search Mistakes
32. Describe the steps involved in creating an effective data visualization?
Creating an effective data visualization involves several key steps:
- Understand the data: Gain a deep understanding of the dataset, including its structure, variables, and relationships, to determine the most relevant aspects to visualize.
- Define the purpose: Clearly define the objective of the visualization and the message you want to convey. Identify the insights or story you want to communicate to the audience.
- Choose the right visualization: Select the appropriate visualization technique that best represents the data and supports the intended message. Consider the data type, relationships, and audience needs.
- Design the visualization: Pay attention to visual aesthetics, including color choices, fonts, and layout. Use appropriate chart titles, labels, and legends to provide context and aid interpretation.
- Simplify and declutter: Avoid clutter and unnecessary complexity. Remove any non-essential elements that can distract from the main message.
- Provide context and annotations: Include annotations, captions, or additional text to provide context, highlight key findings, or guide the audience’s interpretation of the visualization.
- Iterate and refine: Review the visualization critically and iterate based on feedback. Continuously refine the design to improve clarity and effectiveness.
- Test and validate: Share the visualization with a sample audience and gather feedback to ensure it effectively communicates the intended message and insights.
By following these steps, you can create data visualizations that are clear, engaging, and effectively convey the desired information.
33. What are some common pitfalls to avoid when creating data visualizations?
When creating data visualizations, it is important to avoid common pitfalls that can hinder their effectiveness. Here are some pitfalls to watch out for:
- Cluttered visuals: Avoid overcrowding the visualization with too much information or excessive decoration. Keep it clean and focused on the main message.
- Poor labeling: Ensure that labels, titles, and axis descriptions are clear, concise, and properly positioned. Ambiguous or misleading labels can confuse the audience.
- Misrepresentation: Be cautious of distorting or misrepresenting the data. Ensure that the scales, proportions, and axes accurately reflect the data to prevent misleading interpretations.
- Lack of context: Provide context and background information to help the audience understand the data and its significance. Without proper context, the visualization may be misinterpreted.
- Inappropriate chart choice: Select the appropriate chart type that best represents the data and supports the message. Using an incorrect or misleading chart can lead to confusion or misinterpretation.
- Overemphasis on aesthetics: While aesthetics are important, do not prioritize visual appeal over clarity and accuracy. The visualization should effectively communicate insights rather than being solely focused on aesthetics.
Avoiding these pitfalls can help ensure that your data visualizations are accurate, clear, and meaningful, resulting in effective communication of insights to the audience.
34. Explain the importance of storytelling in data visualization?
Storytelling in data visualization is crucial for effectively communicating insights and engaging the audience. Here’s why storytelling is important:
- Engages the audience: A compelling story captures the audience’s attention and keeps them engaged throughout the visualization. It helps create an emotional connection and makes the data more relatable.
- Enhances understanding: By structuring the visualization as a story, you can guide the audience through a logical narrative flow, making complex data more understandable and memorable.
- Contextualizes the data: Storytelling provides context, background, and explanations that help the audience interpret and understand the data in a meaningful way. It answers the “why” behind the data.
- Highlights key insights: Through storytelling, you can effectively emphasize the most important findings or insights in the data, ensuring that the audience grasps the key takeaways.
- Increases impact and retention: Well-crafted storytelling in data visualization has a higher impact and increases the likelihood that the audience will remember and act upon the insights presented.
By incorporating storytelling techniques into data visualization, you can transform data into a compelling narrative that resonates with the audience, making the insights more memorable and actionable.
35. What are some popular data visualization tools and libraries?
There are several popular tools and libraries available for data visualization. Here are some commonly used ones:
- Tableau: A powerful and user-friendly data visualization tool with a wide range of features and options for creating interactive and visually appealing visualizations.
- D3.js: A JavaScript library that provides extensive capabilities for creating custom and interactive data visualizations using web technologies.
- Matplotlib: A widely used plotting library in Python for creating static, publication-quality visualizations with a wide range of chart types.
- ggplot2: A popular data visualization package in R that follows the grammar of graphics framework, allowing for flexible and customizable visualizations.
- Power BI: A business intelligence tool by Microsoft that enables interactive and dynamic data visualizations, reporting, and dashboard creation.
- Plotly: A versatile data visualization library available for multiple programming languages, including Python, R, and JavaScript, offering interactive and shareable visualizations.
- Seaborn: A Python library built on top of Matplotlib that provides additional statistical visualizations and enhances the aesthetics of plots.
These tools and libraries offer a variety of features, capabilities, and programming language support, allowing users to choose the one that best fits their needs and preferences for creating impactful data visualizations.
Statistical Concepts
36. What is the difference between a sample and a population?
In statistics, a population refers to the entire group or set of individuals, items, or data points that are of interest to the study. It represents the complete collection of subjects or elements from which data is gathered. On the other hand, a sample is a subset or a smaller representative portion of the population. It is selected from the population to draw inferences or make conclusions about the population as a whole. Samples are used when studying the entire population is not feasible due to factors such as time, cost, or practical constraints. The goal of sampling is to obtain a representative sample that accurately reflects the characteristics of the population it was drawn from.
37. Explain the concept of statistical power and its significance?
Statistical power refers to the probability of correctly rejecting a null hypothesis when it is false, or in simpler terms, the ability of a statistical test to detect an effect or relationship if it exists. It is influenced by factors such as sample size, effect size, significance level, and variability in the data.
Having high statistical power is important because it increases the likelihood of detecting true effects or relationships in the data. A study with low power may fail to detect significant results, leading to false-negative conclusions or the inability to detect important findings. By ensuring adequate statistical power in research design and sample size determination, researchers can increase the chances of finding meaningful and reliable results.
38. What is the purpose of analysis of variance (ANOVA) in statistical analysis?
Analysis of Variance (ANOVA) is a statistical technique used to compare the means of two or more groups or conditions. It determines whether the differences observed between group means are statistically significant or if they are likely due to random variability. ANOVA partitions the total variability in the data into different sources, such as between-group variability and within-group variability.
The main purposes of ANOVA include:
- Assessing group differences: ANOVA helps determine if there are statistically significant differences in the means of multiple groups or conditions.
- Identifying significant factors: ANOVA allows for the identification of significant factors that contribute to the observed differences.
- Understanding interaction effects: ANOVA can assess if the effect of one factor on the outcome depends on the levels of another factor.
- Making inference: ANOVA helps draw conclusions about the population based on the sample data.
ANOVA is widely used in various fields, including psychology, social sciences, business, and biomedical research, to compare group means and examine the effects of different factors or treatments.
39. Describe the concept of multicollinearity and its impact on regression models?
Multicollinearity refers to a high correlation or linear relationship between two or more predictor variables (independent variables) in a regression model. It indicates that these variables are providing redundant or overlapping information.
The impact of multicollinearity on regression models includes:
- Unreliable coefficient estimates: Multicollinearity makes it difficult to determine the individual effect of each predictor variable, leading to unstable and imprecise coefficient estimates.
- Reduced interpretability: With multicollinearity, it becomes challenging to interpret the impact of individual predictors on the response variable since their effects are confounded by the presence of other correlated predictors.
- Inflated standard errors: Multicollinearity inflates the standard errors of the coefficient estimates, making it harder to detect statistically significant effects.
- Difficulty in identifying important predictors: Multicollinearity can mask the importance of variables that are highly correlated with other predictors, leading to difficulties in identifying the most influential predictors.
To address multicollinearity, options include removing correlated variables, combining them into composite variables, or using regularization techniques like ridge regression or lasso regression that can handle multicollinear predictors.
40. Explain the concept of confidence intervals and their interpretation?
Confidence intervals provide a range of values within which the true population parameter is likely to lie, given the sample data and a chosen level of confidence. It is a statistical measure that quantifies the uncertainty associated with estimating population parameters.
Interpretation of a confidence interval involves the following key points:
- Point estimate: The confidence interval is centered around a point estimate, typically the sample mean or proportion, which provides the best estimate of the population parameter based on the sample data.
- Interval width: The width of the confidence interval reflects the level of uncertainty in the estimation. Wider intervals indicate greater uncertainty, while narrower intervals suggest higher precision.
- Level of confidence: The chosen level of confidence (e.g., 95% or 99%) represents the probability that the true population parameter falls within the calculated interval in repeated sampling.
- Generalization to the population: The confidence interval allows for the generalization of the sample findings to the larger population. It provides a range of plausible values for the population parameter, acknowledging the sampling variability.
For example, a 95% confidence interval for a sample mean of 50 with a width of 10 (45 to 55) means that if the sampling process were repeated multiple times, 95% of the resulting intervals would contain the true population mean.
Machine Learning Concepts
41. What is overfitting in machine learning, and how can it be prevented?
Overfitting occurs when a machine learning model learns the training data too well and performs poorly on unseen or new data. It happens when the model becomes overly complex and captures noise or random fluctuations in the training data, leading to poor generalization.
To prevent overfitting, various techniques can be employed:
- Use more data: Increasing the size of the training dataset can help the model capture more representative patterns and reduce the risk of overfitting.
- Feature selection: Selecting only the most relevant features can reduce the complexity of the model and prevent it from memorizing noise.
- Regularization: Applying regularization techniques, such as L1 or L2 regularization, adds a penalty term to the model’s objective function, discouraging complex or extreme parameter values.
- Cross-validation: Employing techniques like k-fold cross-validation helps assess the model’s performance on unseen data and detect signs of overfitting.
- Early stopping: Monitoring the model’s performance on a validation set and stopping the training process when the performance begins to degrade can prevent overfitting.
- Ensemble methods: Combining multiple models through techniques like bagging, boosting, or stacking can reduce overfitting by leveraging the diversity and collective wisdom of the ensemble.
By employing these preventive measures, one can reduce the likelihood of overfitting and improve the generalization ability of machine learning models.
Read also – 10 Words You Should Not Use at a Job Interview
42. Describe the bias-variance tradeoff in machine learning?
The bias-variance tradeoff is a fundamental concept in machine learning that deals with the relationship between the bias (underfitting) and variance (overfitting) of a model.
- Bias: Bias refers to the error introduced by approximating a real-world problem with a simplified model. A model with high bias tends to oversimplify the underlying patterns, leading to underfitting. High bias can result in systematic errors and poor performance on both the training and test data.
- Variance: Variance refers to the model’s sensitivity to the random fluctuations in the training data. A model with high variance fits the training data too closely, capturing noise and random variations. This leads to overfitting and poor performance on unseen data.
The goal is to strike a balance between bias and variance to achieve optimal model performance. A model with too much bias cannot capture the underlying patterns, while a model with too much variance is overly sensitive to noise.
The tradeoff can be managed through techniques like regularization, model complexity control, or ensemble methods. Understanding the bias-variance tradeoff helps in selecting appropriate models and optimizing their performance.
43. What are some common evaluation metrics for classification models?
Evaluation metrics for classification models assess the model’s performance in predicting categorical outcomes. Some common evaluation metrics include:
- Accuracy: The proportion of correctly classified instances out of the total number of instances in the dataset.
- Precision: The ability of the model to correctly identify positive instances out of the total instances predicted as positive. It measures the precision of positive predictions.
- Recall (Sensitivity/True Positive Rate): The ability of the model to correctly identify positive instances out of the total actual positive instances. It measures the coverage of positive instances.
- F1 score: The harmonic mean of precision and recall. It provides a single metric that balances both precision and recall.
- Specificity (True Negative Rate): The ability of the model to correctly identify negative instances out of the total actual negative instances.
- Area Under the ROC Curve (AUC-ROC): The measure of the model’s ability to distinguish between positive and negative instances across different classification thresholds.
- Confusion Matrix: A matrix that shows the counts or proportions of true positive, true negative, false positive, and false negative predictions.
The choice of evaluation metric depends on the problem domain, the nature of the data, and the specific goals of the classification task.
44. Explain the concept of ensemble learning and its benefits?
Ensemble learning is a machine learning technique that combines multiple individual models, called base learners, to make predictions. By leveraging the collective wisdom of multiple models, ensemble learning can often achieve better predictive performance compared to a single model.
Benefits of ensemble learning include:
- Improved accuracy: Ensemble models can reduce the impact of bias and variance by aggregating the predictions of multiple models, leading to more accurate and reliable predictions.
- Better generalization: Ensemble models have a higher chance of generalizing well to unseen data by combining different perspectives and capturing diverse patterns in the data.
- Increased robustness: Ensemble models are typically more robust against noisy or outlier data points, as the influence of individual models is balanced out by the ensemble.
- Enhanced stability: Ensemble models tend to be more stable and less sensitive to small changes in the training data compared to individual models.
- Versatility: Ensemble learning can be applied to various types of learning algorithms, such as decision trees, neural networks, or support vector machines, providing flexibility and adaptability across different domains.
Ensemble learning techniques include bagging (e.g., Random Forest), boosting (e.g., AdaBoost, Gradient Boosting), and stacking, among others.
45. How do you handle missing values in a machine learning dataset?
Handling missing values is crucial to ensure accurate and reliable machine learning models. Here are some common techniques for handling missing values in a dataset:
- Removal: If the missing values are relatively small in number and randomly distributed, removing the corresponding rows or columns may be a viable option. However, caution should be exercised as this approach may lead to information loss.
- Imputation: Imputation involves filling in missing values with estimated values. Common imputation techniques include replacing missing values with mean, median, or mode values for numerical variables. For categorical variables, missing values can be replaced with the most frequent category.
- Advanced imputation: Advanced imputation techniques, such as regression imputation, k-nearest neighbors imputation, or multiple imputation, can be employed to estimate missing values based on relationships with other variables.
- Indicator variables: Creating an additional binary indicator variable that denotes the presence or absence of missing values can be helpful. This allows the model to capture any potential information associated with missingness.
- Special treatment: For some cases, missing values may have a specific meaning or pattern. It’s important to handle them accordingly. For example, a missing value in a time series dataset may indicate that the data was not available at that particular time point.
The choice of handling missing values depends on the dataset, the amount of missingness, the underlying reasons for missing values, and the impact on the analysis or predictive task. It is essential to carefully consider the appropriate technique and its potential impact on the results.
Business and Communication Skills
46. How do you prioritize and manage multiple projects as a data analyst?
Prioritizing and managing multiple projects as a data analyst requires effective organization and time management skills. Here are some strategies to consider:
- Assess project importance: Evaluate the urgency, impact, and strategic value of each project. Prioritize projects that align with organizational goals or have imminent deadlines.
- Break projects into tasks: Break down each project into smaller, manageable tasks. Identify dependencies and estimate the effort required for each task.
- Set realistic deadlines: Set realistic deadlines for each task based on its complexity and priority. Communicate the timelines to stakeholders to manage expectations.
- Create a schedule: Create a schedule or project management tool to track and allocate time for each task. Consider using techniques like Agile or Kanban to manage workflow.
- Delegate and collaborate: If possible, delegate tasks to team members or collaborate with colleagues to distribute the workload. Effective collaboration can help in managing multiple projects efficiently.
- Communicate and manage expectations: Regularly communicate with stakeholders and project sponsors to keep them informed about progress, challenges, and any adjustments in timelines. Manage expectations by providing realistic updates.
- Adapt and adjust: Be flexible and open to adjusting priorities as new information or urgent tasks arise. Continuously reassess the project status and adjust timelines or resources as needed.
By employing these strategies, you can effectively prioritize and manage multiple projects, ensuring timely delivery and high-quality outcomes.
47. Describe a situation where you had to communicate complex data analysis to non-technical stakeholders?
In my previous role, I had to present the findings of a complex data analysis project to a group of non-technical stakeholders. The analysis involved sophisticated statistical models and technical terminology. To effectively communicate the analysis, I employed the following strategies:
- Understand the audience: I familiarized myself with the background, roles, and knowledge level of the stakeholders. This helped me tailor the presentation to their needs and frame the analysis in a way that was relevant and understandable to them.
- Simplify the language: I avoided technical jargon and used plain language to explain complex concepts. I focused on conveying the key insights and actionable findings without overwhelming them with technical details.
- Use visual aids: I created visually appealing charts, graphs, and infographics to visually represent the analysis results. Visual aids helped in conveying the main points quickly and made the presentation more engaging.
- Provide context and examples: I provided real-world examples and relatable scenarios to illustrate the implications of the analysis. This helped the stakeholders grasp the practical significance and potential applications of the findings.
- Encourage questions and interaction: I encouraged stakeholders to ask questions and participate in the discussion. This allowed for clarification and ensured their understanding of the analysis. I addressed their concerns and provided additional explanations when needed.
By following these strategies, I was able to effectively communicate the complex data analysis to non-technical stakeholders, ensuring their comprehension and facilitating meaningful discussions around the insights.
48. How do you ensure the accuracy and reliability of your data analysis results?
Ensuring the accuracy and reliability of data analysis results is crucial for making informed decisions. Here are some practices to ensure the integrity of data analysis:
- Data quality assurance: Begin by thoroughly checking the quality of the data, including completeness, consistency, and correctness. Perform data cleaning and validation processes to address any errors or inconsistencies in the dataset.
- Robust data preprocessing: Implement careful data preprocessing steps, such as handling missing values, outlier detection and treatment, data transformation, and normalization. These steps help in preparing the data for analysis while maintaining data integrity.
- Use appropriate statistical techniques: Apply appropriate statistical techniques and models that are suitable for the data and research objectives. Ensure that assumptions and prerequisites of the chosen techniques are met.
- Validate and verify: Perform cross-validation, using different subsets of the data or alternative validation techniques, to ensure that the results are consistent and reliable. Verify the analysis outputs by independently replicating the analysis or seeking peer review.
- Sensitivity analysis: Conduct sensitivity analysis to assess the robustness of the results to changes in assumptions, parameters, or methodologies. This helps evaluate the stability and reliability of the findings.
- Documentation and reproducibility: Document the entire data analysis process, including data preprocessing, modeling, and interpretation steps. Share the code, scripts, or workflow used in the analysis to enable reproducibility and facilitate peer review.
- Peer review and feedback: Seek input from colleagues or subject matter experts to review and validate the analysis. Peer review helps identify any potential errors, biases, or oversights, improving the accuracy and reliability of the results.
By following these practices, data analysts can ensure the accuracy, reliability, and robustness of their data analysis results, enhancing the trustworthiness and credibility of the insights generated.
49. Explain the importance of data governance and data privacy in an organization?
Data governance and data privacy are critical aspects of managing data in an organization. Here’s why they are important:
- Data governance: Data governance encompasses the policies, procedures, and controls to ensure the proper management, quality, and security of data within an organization. It establishes a framework for data-related decision-making, data ownership, data standards, and data lifecycle management. Key benefits of data governance include:
- Data integrity and quality: Data governance ensures that data is accurate, reliable, and consistent across the organization, enhancing data-driven decision-making.
- Compliance and risk management: Data governance ensures adherence to regulatory requirements, privacy laws, and industry standards, reducing legal and reputational risks.
- Data access and security: Data governance establishes controls and permissions for data access, protecting sensitive information from unauthorized use, breaches, or data leaks.
- Data accountability and ownership: Data governance assigns responsibility for data management, ensuring clear roles, accountability, and ownership of data assets within the organization.
- Data privacy: Data privacy refers to protecting personally identifiable information (PII) and sensitive data from unauthorized access, use, or disclosure. It involves complying with privacy laws, regulations, and ethical considerations. Key reasons for prioritizing data privacy include:
- Trust and reputation: Respecting individuals’ privacy rights builds trust with customers, employees, and stakeholders, enhancing the organization’s reputation.
- Legal and regulatory compliance: Compliance with data protection laws and regulations, such as GDPR or CCPA, avoids legal penalties and sanctions.
- Minimizing data breaches: Protecting sensitive data reduces the risk of data breaches, which can result in financial loss, legal consequences, and reputational damage.
- Ethical considerations: Respecting privacy is an ethical obligation, ensuring individuals’ autonomy, consent, and protection of their personal information.
Organizations that prioritize data governance and data privacy establish a strong foundation for responsible data management, safeguarding data assets, and maintaining trust with stakeholders.
50. How do you stay updated with the latest trends and technologies in data analysis?
Staying updated with the latest trends and technologies in data analysis is essential for professional growth and maintaining a competitive edge. Here are some strategies to stay updated:
- Continuous learning: Engage in continuous learning by attending conferences, workshops, webinars, and industry events focused on data analysis and related fields. Participate in online courses, tutorials, or MOOCs to learn new techniques and technologies.
- Professional networks: Join professional networks, online forums, and communities focused on data analysis. Engage in discussions, seek advice, and share knowledge with industry peers and experts. Platforms like LinkedIn and GitHub can be valuable for connecting with like-minded professionals.
- Blogs and publications: Follow reputable blogs, online publications, and data-focused websites to access articles, tutorials, case studies, and thought leadership content. Subscribe to newsletters or RSS feeds to receive regular updates.
- Thought leaders and influencers: Follow influential figures in the data analysis field on social media platforms like Twitter or LinkedIn. Their insights, posts, and recommendations can provide valuable information about emerging trends and technologies.
- Hands-on projects: Undertake personal projects or participate in open-source initiatives to gain practical experience with new tools, frameworks, or techniques. Experimenting with real-world datasets helps in understanding and applying the latest approaches.
- Online resources and platforms: Explore online resources, platforms, and repositories like GitHub, Kaggle, or DataCamp, which provide access to code repositories, datasets, tutorials, and challenges. These platforms often showcase state-of-the-art techniques and best practices.
- Webinars and podcasts: Attend webinars and listen to podcasts that focus on data analysis, machine learning, or data science. These platforms offer insights, expert discussions, and updates on the latest trends.
By combining these strategies, data analysts can stay updated with the latest trends, technologies, and best practices in data analysis, enabling them to continuously enhance their skills and adapt to evolving industry requirements.
Industry-Specific Questions
51. What are some key metrics to track in e-commerce data analysis?
Key metrics to track in e-commerce data analysis include conversion rate, average order value (AOV), customer lifetime value (CLV), churn rate, cart abandonment rate, customer acquisition cost (CAC), return on investment (ROI), website traffic, and customer satisfaction metrics.
52. How can data analysis help improve customer satisfaction in the retail industry?
Data analysis helps improve customer satisfaction in the retail industry by analyzing customer behavior, sentiment, and preferences. It enables personalization, customer segmentation, sentiment analysis, inventory management, pricing optimization, and personalized recommendations, leading to enhanced customer experiences and improved satisfaction.
Read also – Should You Ditch Your Engagement Ring for Job Interviews?
54. Describe some use cases of data analysis in the healthcare industry?
Data analysis in the healthcare industry has several use cases, including predictive analytics for disease identification, disease surveillance, treatment effectiveness evaluation, healthcare resource optimization, fraud detection, and precision medicine. These applications aid in early intervention, public health monitoring, informed decision-making, resource allocation, fraud prevention, and personalized treatment.
55. How can data analysis help optimize marketing campaigns?
Data analysis optimizes marketing campaigns by enabling customer segmentation, A/B testing, conversion funnel analysis, attribution analysis, customer lifetime value (CLV) analysis, and predictive modeling. It helps tailor marketing messages, identify effective campaign elements, optimize the customer journey, allocate resources efficiently, and forecast campaign performance, resulting in higher effectiveness and return on investment.
Behavioral Questions
56. Describe a challenging data analysis project you worked on and how you overcame obstacles
In a challenging data analysis project, I encountered a large and complex dataset with missing values and inconsistencies. To overcome these obstacles, I implemented data cleaning techniques to handle missing data and performed rigorous data validation to ensure accuracy. I also collaborated with domain experts to gain a better understanding of the data and refine the analysis approach. Additionally, I utilized advanced statistical methods and visualization techniques to extract meaningful insights from the dataset. By breaking down the project into smaller tasks, staying organized, and maintaining open communication with stakeholders, I successfully navigated the challenges and delivered actionable findings.
57. How do you handle tight deadlines and high-pressure situations as a data analyst?
When faced with tight deadlines and high-pressure situations, I prioritize tasks, ensuring that critical aspects are addressed first. I break down the project into manageable chunks and create a timeline with clear milestones. Effective time management and communication are essential, so I keep stakeholders informed about progress and potential challenges. To stay focused and maintain quality, I adopt efficient data analysis techniques and leverage existing tools or code libraries. Additionally, I proactively seek assistance from team members if needed and remain adaptable to unexpected changes. By staying organized, maintaining a calm approach, and utilizing efficient strategies, I effectively manage tight deadlines and high-pressure situations.
58. Describe a situation where you had to work in a team to accomplish a data analysis task?
In a data analysis task, I collaborated with a team to analyze a large dataset for a marketing campaign. We divided the workload based on individual strengths and expertise, with each team member responsible for specific aspects of the analysis, such as data preprocessing, feature engineering, modeling, and visualization. We held regular team meetings to share progress, discuss challenges, and ensure alignment. Effective communication played a crucial role, as we coordinated efforts, shared insights, and provided feedback to improve the analysis. By leveraging diverse skills and collaborating closely, we were able to deliver a comprehensive and impactful data analysis that informed strategic decisions for the marketing campaign.
59. How do you handle feedback and criticism of your work?
When receiving feedback and criticism of my work, I approach it with an open and constructive mindset. I listen attentively, seeking to understand the perspective of the person providing the feedback. I view feedback as an opportunity for growth and improvement. I take the time to reflect on the comments, analyzing them objectively and assessing whether they align with the project’s goals and requirements. If valid points are raised, I acknowledge them and take steps to address them. I actively seek clarification if needed and engage in a respectful dialogue to gain a deeper understanding of the feedback. Ultimately, I view feedback as a valuable learning experience that helps me refine my skills and produce even better results in future projects.
General Questions
60. Why did you choose a career in data analysis?
I chose a career in data analysis because I have always been fascinated by the power of data to uncover insights and drive informed decision-making. I enjoy the process of extracting meaningful information from complex datasets and using it to solve real-world problems. Data analysis allows me to combine my analytical skills, curiosity, and passion for problem-solving, making it a perfect fit for my career aspirations.
61. What are your favorite data analysis tools and why?
My favorite data analysis tools include Python and its libraries such as Pandas and NumPy. Python provides a versatile and powerful environment for data manipulation, analysis, and visualization. Pandas offers efficient data handling capabilities, while NumPy provides robust numerical operations. These tools enable me to perform data analysis tasks efficiently and effectively, allowing me to extract insights from data and communicate findings visually.
62. How do you approach problem-solving in data analysis?
When approaching problem-solving in data analysis, I follow a systematic approach. First, I clearly define the problem and understand the goals and objectives. Then, I gather and explore the data, identifying patterns, trends, and potential challenges. Next, I formulate a hypothesis or develop a strategy to address the problem, selecting appropriate data analysis techniques and models. I implement the analysis, interpret the results, and validate them for accuracy and reliability. Finally, I communicate the findings in a clear and concise manner, ensuring they are actionable and relevant to the problem at hand.
63. Describe a time when you had to learn a new programming language or tool quickly?
In a previous project, I had to quickly learn R programming language to perform statistical analysis and generate visualizations. Despite having limited prior experience with R, I took the initiative to study online tutorials and documentation to gain a foundational understanding. I also engaged with experienced colleagues for guidance and support. Through hands-on practice and experimentation, I became proficient in R within a short period. This allowed me to successfully complete the project on time, demonstrating my adaptability and commitment to learning new tools and technologies.
64. What are your long-term career goals in the field of data analysis?
My long-term career goals in the field of data analysis include becoming a seasoned data professional, continuously expanding my knowledge and expertise. I aspire to take on more complex and challenging projects, leading teams and contributing to the development of innovative data analysis strategies. I aim to leverage data analysis to drive impactful decision-making, solve critical business problems, and make a positive impact on organizations and industries.
65. How do you ensure the quality and integrity of data in your analysis?
To ensure the quality and integrity of data in my analysis, I employ several practices. I carefully review and clean the data, addressing missing values, outliers, and inconsistencies. I validate the data against established standards or benchmarks, cross-checking with external sources where applicable. I also perform data audits, examining data lineage and conducting data quality checks to identify any potential issues. Additionally, I document all data preprocessing and transformation steps, ensuring transparency and reproducibility. By implementing these measures, I maintain the accuracy and reliability of data throughout the analysis process.
Do you have any questions for us?
Yes, I do. Can you provide more insights into the data analysis projects and initiatives that your company is currently working on? Additionally, what role does data analysis play in driving decision-making and strategy within the organization?
Being well-prepared for data analyst interviews is crucial to showcase your skills and knowledge in the field. By understanding and effectively answering these interview questions, you can demonstrate your expertise in data analysis and increase your chances of securing a job in this competitive field in 2023.


